Agent Observability: What to Monitor Beyond Latency
Agent Observability means looking beyond latency. Rekap shows real-time token use, tool calls, retries, and decision paths so teams see how agents work, catch failures early, and keep workflows accountable. Clarity replaces guesswork, helping operators act with confidence.
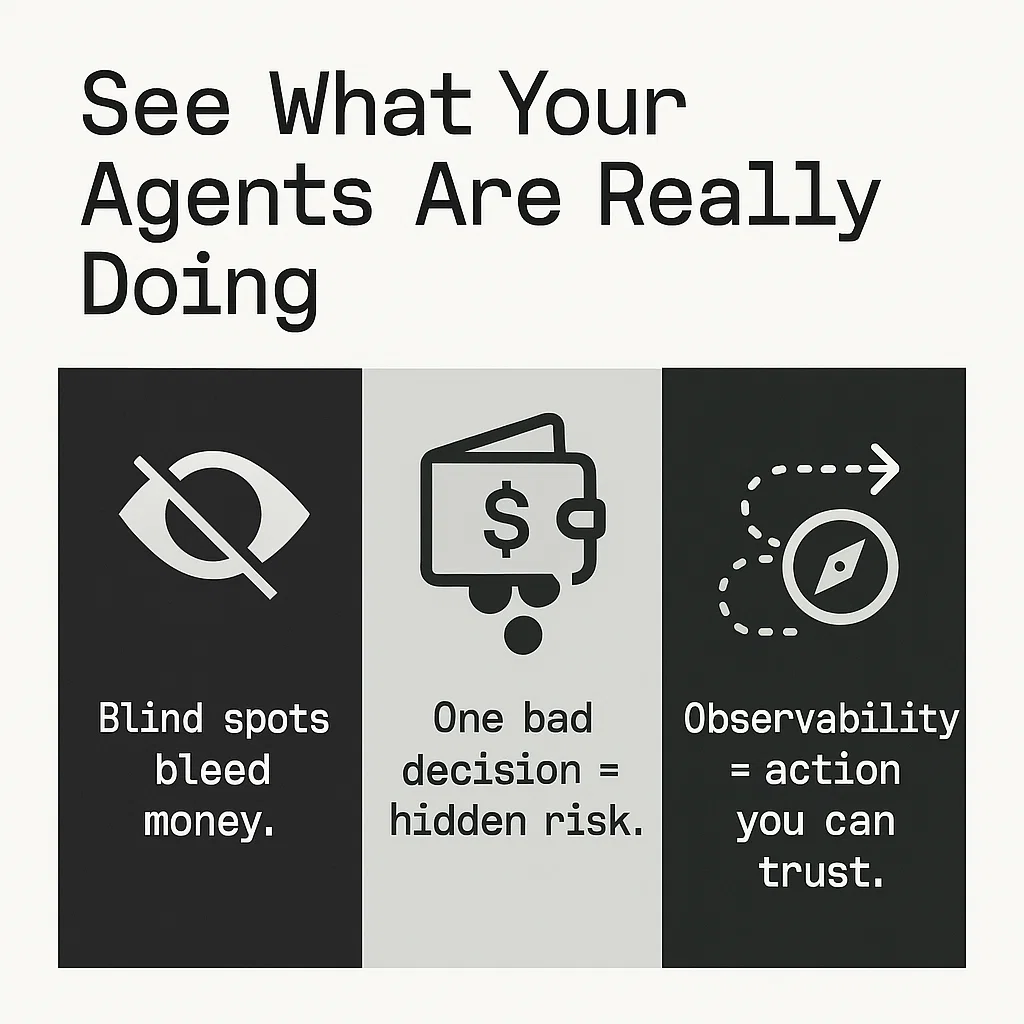
Ever lost valuable progress because an agentic AI failed without explanation? That is the frustration behind systems that look smooth on the surface but hide problems underneath.
This is where Agent Observability comes in. It is the discipline of understanding what your execution layer is doing beyond tracking response time. Latency numbers alone do not show the full picture.
Teams need visibility into tool usage, token usage, and telemetry data that show how the system makes decisions in real time. With that level of clarity, failures stop being surprises and start becoming solvable.
The Evolution of Observability in AI
When AI agents fail without explanation, critical work stalls. Observability once meant watching uptime and latency, but those numbers alone miss the bigger risks. Modern Agent Observability now includes model accuracy, data integrity, hallucinations, prompt injection, and the handling of sensitive data.
Research shows that performance cannot be trusted if accuracy and integrity are not measured in real time. A system that responds quickly but delivers flawed or biased results still creates failure.
Industry experts emphasize that agent performance depends on how systems think, decide, and act. New observability practices track token usage, tool calls, and signs of hallucinations as they unfold, giving teams visibility into actual behavior instead of surface-level speed.
Foundations of AI Agent Observability via MELT Framework
Effective visibility into complex systems rests on four types of telemetry data: Metrics, Events, Logs, and Traces (known as MELT). Each plays a distinct role in revealing what agents are doing and why.
Metrics provide quantitative signals like token usage, tool interactions, and decision paths.
Events capture moments of change such as tool calls, retries, or threshold breaches.
Logs give context-rich records of actions, errors, and system states.
Traces map full journeys through multi step workflows, showing how decisions unfold.
This setup matters because AI agents behave differently from traditional software. They reason, adapt, and act on dynamic prompts. The MELT framework ensures we capture both system health and the nuanced behavior of the agents themselves, giving teams real clarity into what’s working and what needs attention.
Trustworthiness Through Measurement Standards
Trust begins with measuring what matters. The NIST AI RMF’s Measure function defines how to set trust and performance metrics for safety and clarity.
Reliability Metrics: Use accuracy, precision, recall to assess whether the agent behaves consistently over time.
Bias Indicators: Establish fairness checks that surface harmful bias and ensure outputs remain balanced.
Anomaly Detection: Track unusual spikes in errors or token usage to stop issues before they spread.
Drift Tracking: Watch for changes in input patterns or performance over time that indicate degradation.
These metrics anchor observability in trust, safety, and accountability. When systems report reliability and fairness, teams can act—not react. That clarity underpins ethical and effective AI.
Emerging Research Frameworks Enabling Agent Observability
Researchers are building observability systems tailored for agent workflows. These frameworks go beyond logging and dashboards to surface intent, failures, and coordination issues.
AgentOps Taxonomy
Maps artifacts and telemetry across an agent’s lifecycle. It serves as a reference for what to capture from prompts and plans to execution steps and artifacts. That makes observability comprehensive and reliable.
AgentSight
Bridges the gap between an agent’s intent and system-level actions. It uses eBPF to intercept model communications and track system calls. This boundary tracing reveals prompt injection, wasted loops, and agent coordination issues in real time.
LumiMAS
Adds a monitoring layer for multi-agent systems. It builds detailed logs, detects anomalies across agents, and offers root cause explanations when things go wrong.
These frameworks set the foundation for observability solutions that track multi-step, agentic behaviors. With real insights, teams can debug and optimize not just report issues.
Commercial Tooling Meets Observability Needs
Visibility into agentic systems has become critical. Teams can no longer afford blind spots when agents make decisions, call tools, or consume resources. Without proper observability, debugging and optimizing failures takes far too long.
Modern monitoring platforms now map decision paths in detail. They track inputs, tool calls, retries, and handoffs, then connect them to cost and security. This makes it possible to see when a single decision path is draining budget or triggering risk.
Some platforms integrate agent monitoring directly into developer workflows. Within the same interface, teams can review token usage, measure slow responses, and isolate failures across environments. This gives clarity on how agent performance shifts between testing and production.
Industry solutions are moving toward observability tools designed for complex agent systems. These solutions give teams the precision they need to act quickly and effectively.
Observability as Trust Engineering Beyond Monitoring
Building trust in AI systems means more than watching performance. It means engineering for safety, accountability, and clarity.
Research shows that systems combining monitoring and control, not just smarter models, actually earn user confidence. Observability must track quality, validation, and compliance in real time and align with evolving regulations.
The NIST AI Risk Management Framework embeds observability across these essential functions:
Govern defines oversight structures and roles.
Measure uses metrics for reliability, fairness, and safety.
Manage addresses anomalies and drift with clear governance.
When teams monitor these dimensions consistently, observability becomes a tool of trust. It brings visibility into decision paths, flags compliance issues, and ensures AI systems remain accountable. That kind of rigour isn’t optional. It’s what separates fragile systems from dependable execution engines.
Human Centered Observability Practices for Every Team
Observability delivers value only when people can act on it, not chase dashboards.
Stakeholders such as Chiefs of Staff, People Operations leaders, Customer Success VPs, and Program Managers rely on clarity in execution and outcomes. Observability dashboards must serve them, not distract them.
Here is how observability supports decision-making across roles:
Scribe and Agent Flow Visibility: After meetings or calls, systems capture next steps automatically. If loops appear or thresholds slip, alerts surface so humans can step in precisely when needed.
Outcome First Focus: Teams can stop measuring for vanity and instead measure for action. Observability is not about flashy graphs. It is about intact workflows, trusted outputs, and reliable results.
When observability is designed around human workflows, it shifts from passive reporting to active execution support and earns the trust of every team it touches.
How to Structure Agent Observability in Practice
Build a live view that shows work, risk, and cost through focused sections your team will actually use.
Execution Hub
Unify Agent Artifacts, Scribe logs, and Automation run history inside Rekap. Attach each artifact to its triggering macro, the Rolodex contact, and the AI Operations stage, with owners, timestamps, status, and next run visible. Link Scribe entries to the sentences that triggered actions for rapid context.
Key Signals
Track retry rates per macro, integration, and stage to catch brittle steps early. Watch cost per execution across meetings, email, and pipeline workflows. Measure RAG precision by logging AI Memory hits, cited document identifiers, and answer coverage. Add token usage, tool usage, decision path length, and loop counts to expose multi step stalls.
Safety Guardrails
Fire anomalous alerts when retries spike, costs climb, or grounding scores drop. Keep audit trails by stitching Scribe transcript pointers, workflow identifiers, and artifact versions to every action. Assign owners and runbooks for each alert. Use Command Center guardrails, Smart Fields, and conditional flows to pause risky sends and route edge cases to a human.
Move From Noise To Action Now
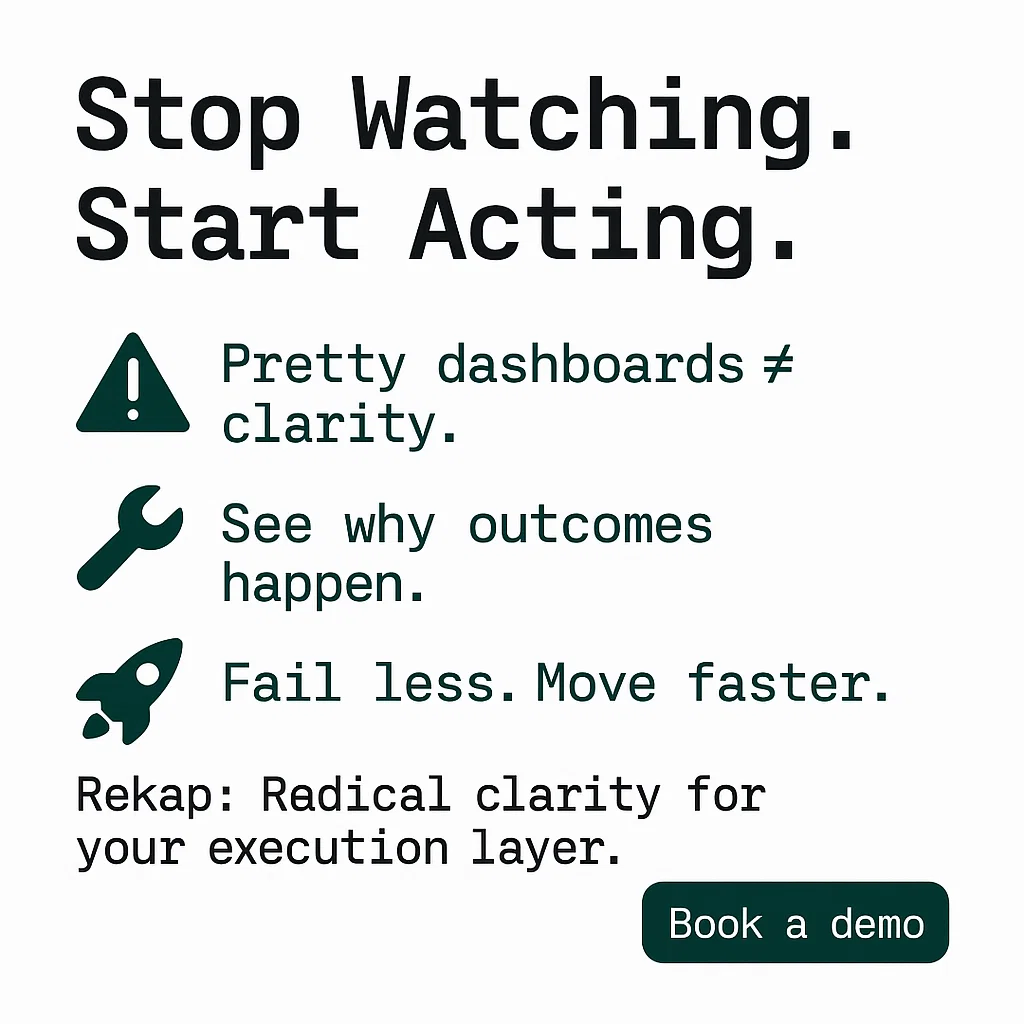
Agent Observability is bigger than latency. Teams need visibility into retries, cost, hallucinations, and decision trails that explain outcomes. If your telemetry stops at graphs, you miss risks and waste money. If observability is not actionable, it becomes noise. Trust grows when you see behavior, detect failure fast, and act without ceremony.
Rekap helps operators replace performance theater with execution that sticks. Bring clarity to signals, close loops quickly, and protect what matters. Embed observability in your execution layer. Do not wait. Get to work. Book a demo now and see failures earlier and ship with steadier confidence today.
Blogs you may like
6 min
read
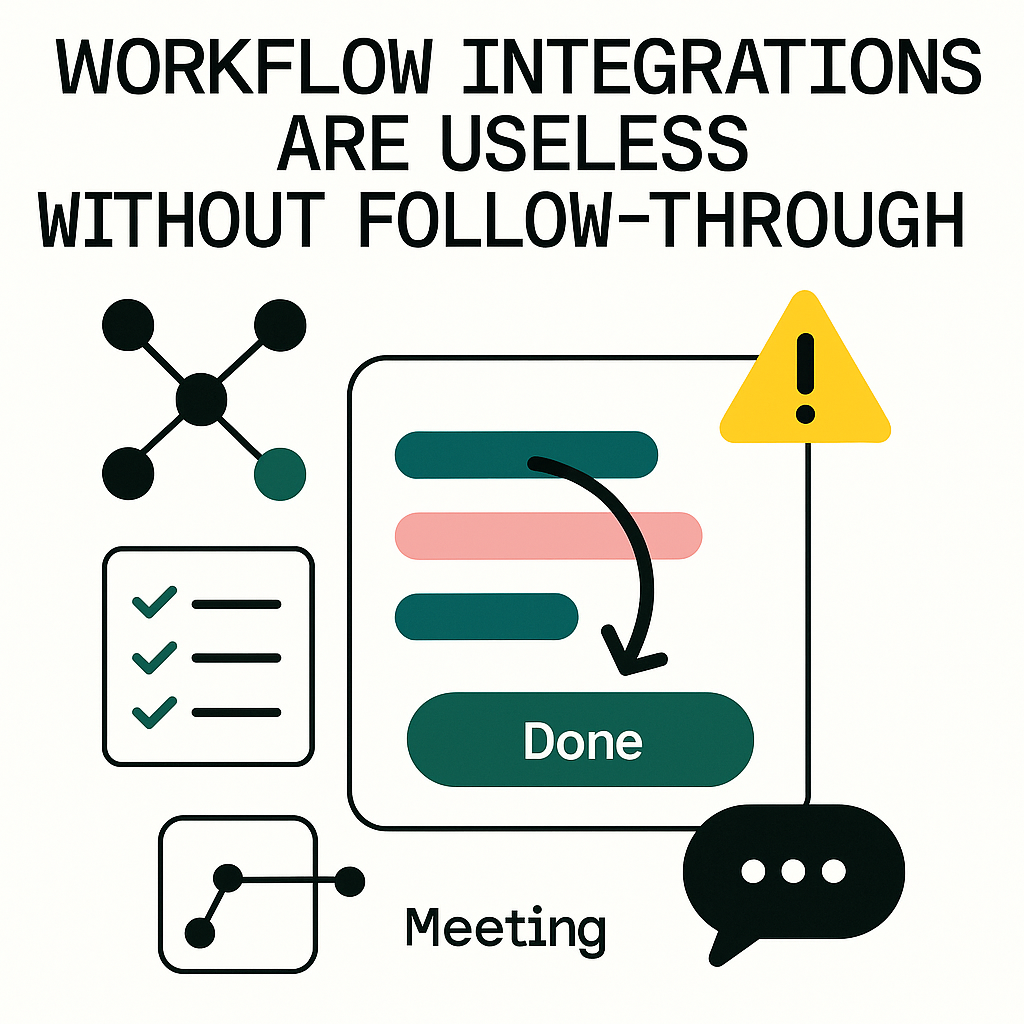
Workflow Integrations Are Useless Without Follow-Through
Workflow integrations alone don’t finish work. Without ownership, visibility, and follow-through, tasks stall and trust erodes. Rekap captures decisions, assigns owners, and automates next steps so meetings and messages turn into outcomes teams and customers can rely on.
Ship Faster with a Team Prompt Library (Backed by Memory)
Work stalls when prompts are scattered and forgotten. A shared prompt library, tied to team memory, keeps context alive, stops rework, and ensures decisions stick. Rekap helps teams ship faster with proven prompts, consistent output, and accountable follow-ups.